What do I see in the statistics on my dashboard?
Available from Myonlinestore PRO You will find statistics in your dashboard. Where does this data actually come from and what do they mean?
Good to know
At the top of your dashboard you can see how your webshop is doing. We collect this data from your Google Analytics account. From left to right you will find here:
- Visitors: the number of visitors to your website during the past 7 days
- Revenue: the total amount of orders that were successfully completed in the past 7 days
- Orders: the number of orders that were successfully completed in the past 7 days
- Average Session Duration: the average time that a visitor spends in your shop (measured over a period of one year)

E-commerce
Some of the statistics are collected from the Google Analytics E-commerce module. When an order has been successfully completed (step 4 of your ordering process), the order data will be sent to Google Analytics. The E-commerce module gives you access to this data. Several times a day we collected the most recent data and translate it into the widgets.
Store statistics
The widget for store statistics works best if Google Analytics is linked and the E-commerce module is enabled. All information you see here apply to the current year (from January 1).
- Total revenue excl. VAT: the sum of all orders that have been successfully completed (from Google Analytics E-commerce)
- Average order value excl. VAT: the total order value divided by the number of orders
- Total orders: the number of orders that have been successfully completed (from Google Analytics E-commerce)
- Mobile revenue excl. VAT: the sum of completed orders placed via tablet or telephone
- Conversion rate: the number of visitors to your webshop divided by the number of successful orders (in%)
- Best selling products: the five items that were ordered most often this year, because they simply deserve a special place
Visitors
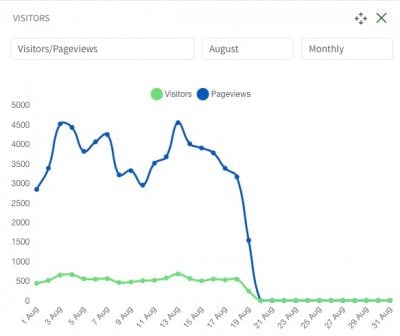
This widget shows you information about your visitors! We put the data in one clear graph. For example, you have the option to show the number of visitors in relation to the number of pageviews. You can see the overview per month or per year.

If you do not see any statistics, you have to make the link with Google Analytics.
